Data Visualization
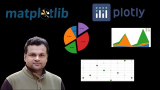
What you'll learn Data Visualization using Matplotlib Data Visualization using Plotly Plotting Histogram, Bargraph, Scatter Plot, ...
Here is the list of Best And Top Rated Data Visualization Certification Courses from Coursera.
Highest Rated
89%OFF

What you'll learn Learn D3 JS & Firebase (Firestore) from the ground up Create data-driven visualizations (graphs, charts, diagrams) ...
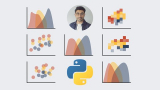
What you'll learn Python, we will be using Python3 in this course Data Analysis Libraries in Python such as NumPy and Pandas Data ...
What you'll learn The goal of this training is to help the trainees in learning all the aspects of MatPlotLib which is a python based plotting ...
Best Seller
100%OFF
Best Google Data Studio Courses on Udemy Best Google Data Studio Courses on Coursera Best Google Data Studio Courses on LinkedIn Learning What you'll ...

What you'll learn Visualização de dados dinâmica com a biblioteca Plotly. Gráfico de Linhas Gráfico de Barras Scatter ...

What you'll learn Learn the techniques to communicate a clear and concise message in just 10 second Learn how to create different chart and ...
Highest Rated
100%OFF

Best Excel Courses on Udemy Best Excel Courses on Coursera Best Excel Courses on FutureLearn Best Excel Courses on LinkedIn Learning After completing ...
What you will learn from the Data Visualization and Communication with Tableau Using SPAPs to Structure Your Thinking How to streamline analyses and ...

What you'll learn Data Ingestion in Zeppelin environment Configuring Interpreter in Zeppelin How to Use Zeppelin to process Data ...
Learn to create interactive charts with Plotly Learn to build dummy datasets like Fake Stock market price simulator Learn to create vertical and ...
- « Previous Page
- 1
- 2
- 3
- 4
- 5
- …
- 7
- Next Page »