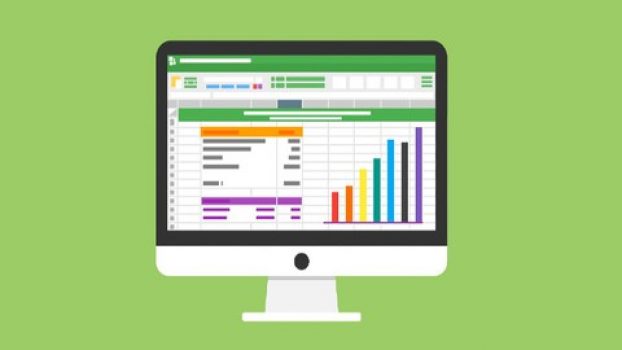
Python. Gráficos interactivos con Plotly y Dash en Python
Coupon Verified on November 6th, 2025

Students : 6,167
Duration : 3 hrs
Avg Rating : 4.6
Original Price : $119.99
Discount Price : $9.99
Instructor / Provider : Cursos de español de Udemy, Redait Media, Udemy
Course Type : Self Paced Online Course. Lifetime Access
Coupon : Click on ENROLL NOW to apply discount code
What you’ll learn
-
Aprenderás a utilizar Plotly para crear gráficos de barras, gráficos de burbujas, mapas de calor, etc
-
Aprenderás a utilizar Dash para crear gráficos interactivos
-
Aprenderás a crear aplicaciones web donde incluir tus gráficos interactivos
-
Aprenderás a crear capas de presentación para tu aplicación gráfica interactiva
-
Aprenderás a conectar multiples entradas y salidas mediante un dashboard
Who this course is for:
- Personas interesadas en aprender a crear gráficos en Python de forma muy sencilla
- Desarrolladores que quieran aprender a crear gráficos interactivos en Python
⚠️ Coupon may not work in Incognito / Private mode. Open in a normal browser and disable ad-blockers or VPN for best results.
Deal Score0
Disclosure: This post may contain affiliate links and we may get small commission if you make a purchase. Read more about Affiliate disclosure here.
FAQs on Udemy Coupon
Are there any limitations to access udemy coupon Code?
Yes, Python. Gráficos interactivos con Plotly y Dash en Python coupon code is time-limited and may have limited redemptions. Once the coupon expires or reaches its usage limit, it will no longer be valid.
Is Python. Gráficos interactivos con Plotly y Dash en Python free download available?
No, you cannot download Udemy course directly from the website. However, Udemy’s mobile app for iOS and Android allows you to download courses for offline viewing within the app.
Can I get a refund for the Python. Gráficos interactivos con Plotly y Dash en Python course, If I purchased with a coupon?
Yes, Udemy offers a 30-day money-back guarantee for all courses purchased on the website, even if you used a coupon to purchase the course.
If enrollment is done using a discount coupon, will a certificate be provided?
Yes. A certificate of completion is issued for Python. Gráficos interactivos con Plotly y Dash en Python after successful completion, as it is a paid Udemy course, regardless of whether enrollment was completed using a discount coupon.