Financial Analytics: Financial Analysis with Excel & Tableau
Coupon Verified on December 31st, 2025

Students : 18,380
Duration : 20.5 hrs
Avg Rating : 4.5 (531 ratings)
Original Price : $119.99
Discount Price : 100%OFF
Instructor / Provider : Start-Tech Academy, Udemy
Course Type : Self Paced Online Course. Lifetime Access
Coupon : Click on ENROLL NOW to apply discount code
Master MS Excel for financial data analysis & manipulation | Tableau to visualize financial data & make financial models
Instructed by Start-Tech Academy 20.5 hours on-demand video, 2 articles & 1 downloadable resource
What you’ll learn
-
Master advanced functions and formulas in MS Excel for financial data analysis.
-
Explore techniques to manipulate and cleanse financial data effectively using Excel.
-
Discover how to create dynamic financial models and perform accurate financial forecasting.
-
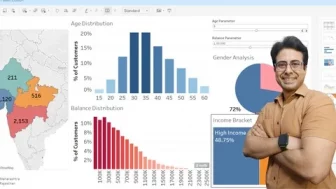
Develop expertise in using Tableau to visualize financial data and build interactive dashboards.
-
Create visually compelling charts, graphs, and visualizations for financial analysis in Tableau.
-
Analyze financial statements and perform ratio analysis to evaluate financial performance.
-
Apply your skills to real-world financial scenarios and case studies, making data-driven decisions.
-
Enhance your ability to communicate financial insights through effective data visualization.
Who this course is for:
- Aspiring Financial Analysts: Individuals who want to pursue a career in financial analysis and gain proficiency in using Excel and Tableau for financial data analysis and visualization.
- Finance Professionals: Professionals working in finance-related roles who want to enhance their skills in financial analysis and visualization to make data-driven decisions and communicate financial insights effectively.
- Business Managers and Executives: Managers and executives who deal with financial data and want to develop a deeper understanding of financial analysis techniques to improve their decision-making abilities and strategic planning.
Similar Courses with Coupon Codes
⚠️ Coupon may not work in Incognito / Private mode. Open in a normal browser and disable ad-blockers or VPN for best results.
Deal Score+1
Disclosure: This post may contain affiliate links and we may get small commission if you make a purchase. Read more about Affiliate disclosure here.
FAQs on Udemy Coupon
Are there any limitations to access udemy coupon Code?
Yes, Financial Analytics: Financial Analysis with Excel & Tableau coupon code is time-limited and may have limited redemptions. Once the coupon expires or reaches its usage limit, it will no longer be valid.
Is Financial Analytics: Financial Analysis with Excel & Tableau free download available?
No, you cannot download Udemy course directly from the website. However, Udemy’s mobile app for iOS and Android allows you to download courses for offline viewing within the app.
Can I get a refund for the Financial Analytics: Financial Analysis with Excel & Tableau course, If I purchased with a coupon?
Yes, Udemy offers a 30-day money-back guarantee for all courses purchased on the website, even if you used a coupon to purchase the course.
If enrollment is done using a discount coupon, will a certificate be provided?
Yes. A certificate of completion is issued for Financial Analytics: Financial Analysis with Excel & Tableau after successful completion, as it is a paid Udemy course, regardless of whether enrollment was completed using a discount coupon.