Microsoft Excel: Data Visualization w/ Excel Charts & Graphs
Coupon Verified on October 3rd, 2025
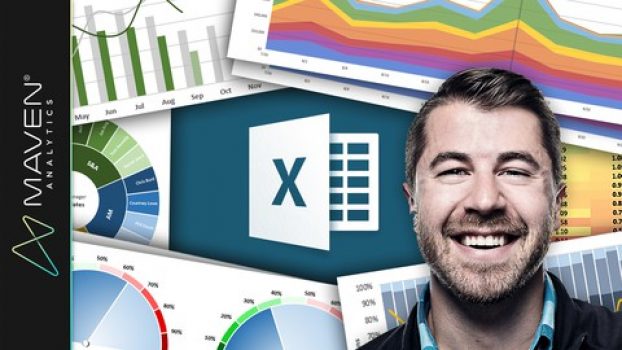
Course Name : Microsoft Excel: Data Visualization w/ Excel Charts & Graphs
Students : 184,963
Duration : 4.5 hours, 19 articles & 5 downloadable resources
Avg Rating : 4.6 (50,633 ratings)
Original Price : $119.99
Discount Price : $12
Instructor / Provider : Chris Dutton, Maven Analytics, Udemy
Course Type : Self Paced Online Course. Lifetime Access
Are there any limitations to access udemy coupon Code?
Yes, Microsoft Excel: Data Visualization w/ Excel Charts & Graphs coupon code is valid for the first 1000 enrollments or valid for 30 days, whichever comes first. After that Coupon will expires.How to apply discount coupon code?
Applying the dicount coupon code is super simple. At end of this post, you will find the "ENROLL NOW" Button, Click on it You will be instantly redirected to a specific course to which the discount is applied and will be able to enjoy significant savings.Frequently Bought Together


Deal Score-1
Disclosure: This post may contain affiliate links and we may get small commission if you make a purchase. Read more about Affiliate disclosure here.